Sector Description
Forty years ago, manufacturing and agriculture ruled the US economy, with services (especially financial) coming on strong. The sleepy TMT Sector (Technology, Media and Telecommunications) played a minor role. Technology consisted of IBM mainframes and Heathkits for the emerging PC nerd. Media meant magazines, newspapers, movies, radio and a few TV network broadcasters – CBS, ABC, NBC and PBS. Telecommunications was all about AT&T.
Today, the market capitalization of TMT companies globally is $5.1 trillion. Companies based in the US account for 57% of the value of the 100 stocks in the NYSE TMT Index, or about $1.3 trillion. Booz Allen claims that global TMT Sector growth was 11% in 2010 and 8.1% in 2011. As Q1 2013 closed, Harris Williams’ “Bellwether” index showed TMT revenue growth of 12% over the last 12 months with an average EBITDA margin of nearly 30%.
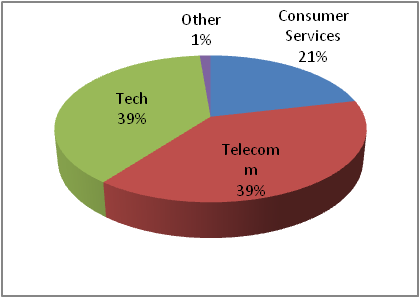
As per the chart below, the NYSE TMT Index breaks down the industry into three broad categories: Telecommunications (39% of total Index value), Technology (38%), and Consumer Services. (21%).
These three subsectors further divide as per the following chart.
| Consumer Services | |
| Broadcast & Entertainment | 13.7% |
| Publishing | 6.1% |
| Media Agencies | 1.6% |
| Total | 21.3% |
| Technology | |
| Computer Services | 13.3% |
| Computer Hardware | 7.1% |
| Semiconductors | 5.6% |
| Software | 5.4% |
| Telecomm Equip | 4.0% |
| Electronic Office Equip | 2.7% |
| Internet | 0.3% |
| Total | 38.4% |
| Telecom | |
| Mobile Telecom | 20.1% |
| Fixed Line Telecom | 18.9% |
| Total | 39.0% |
| Other | |
| Total | 1.6% |
We currently cover five segments within the TMT Sector: Software, Telecommunications, IT Services, Internet & Digital Media, and Social Media. As the TMT Sector evolves, these industries overlap and may acquire different definitions. For instance, Google has taken on the characteristics of both a Social Media platform (Google+) and a cloud-based Software vendor (Googledocs) as well as, of course, a search engine.
What’s next for TMT?
- Mobile device demand will continue to skyrocket. Regardless, PCs will remain as anchors of most applications and storage needs.
- Big Data is coming into its own. Deloitte says that Big Data revenues were only $100 million in 2009 and estimates that such projects generated revenues of $1.0 billion to $1.5 billion in 2012.
- Passwords are under increasing assault at the hands of bad guys using ever-more powerful code-cracking technologies. Password use will begin to decline as biometric and other automated authentication technologies come to the rescue.
- Crowdfunding will continue to grow as a mechanism to escape suffocating regulations and as a way for people to directly invest in ideas about which they are passionate, including non-profit undertakings.
- Prices for flat screens will plumb new lows, putting them in millions of additional homes and positioning the Internet-connected devices as the key family information hub. As manufacturers figure out how to make connectivity more convenient and access speeds increase, consumers will finally begin cutting the pay TV cord.
- One billion smart phones will be sold in 2013. The year will also see hundreds of new LTE (4G) devices and networks, permitting much faster wireless access -- but at a cost.
- Demand for spectrum is bumping up against supply. Congested, urban areas may see service interruptions.
The Software Segment
Segment Description
The global Software industry continues to boom, outpacing the growth of all other TMT segments. Gartner projects Software global growth of 6.4% (or revenues of $296 billion) in 2013 and 6.8% (or revenues of $316 billion) in 2014. The market researcher sees Software revenues of $360 billion in 2016.
North America leads the global Software charge with 7% growth projected in 2013, driven by security applications, storage management and customer relationship management (CRM). In 2014, markets related to Big Data and other information management initiatives (like enterprise content management (ECM), data integration tools, and data quality tools) will see rising demand.
Of the many growth drivers shaping the Software industry, we believe both businesses and consumers will increasingly demand better IT security. That’s because, as cloud and mobile computing get taken up by mainstream users, opportunities for black hats to do harm multiply.
Software Public Comparables
We divide public software companies into two broad categories: vendors of system software versus vendors of application software. With user input, application software automates real-world tasks. System software intermediates between applications and hardware.
System Software
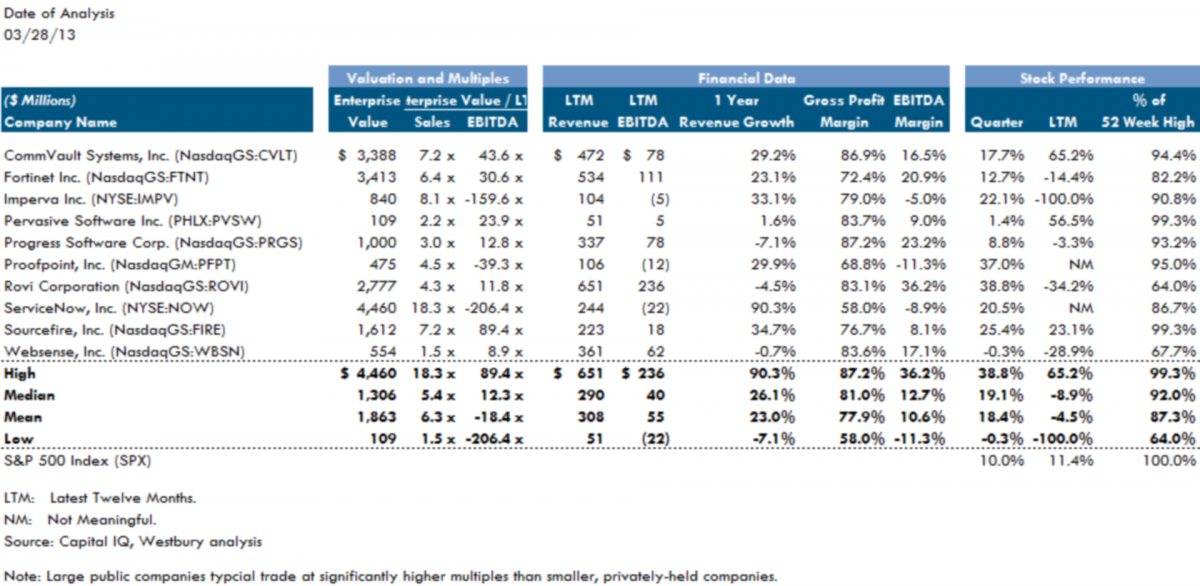
In Q1 2013, our basket of public system software companies had a median enterprise value (EV) of $1.3 billion, or 5.5 times sales and nearly 24 times EBITDA. Over the last 12 months (LTM), system software vendors generated median revenues of $291 million, they grew about 23%, and their stock actually dropped about 2.5% probably because they were overvalued to begin with. Nevertheless, with that kind of top-line growth, they’re on a roll. Many of them participate in the rising demand for managing Big Data, huge media files, security and cloud infrastructure.
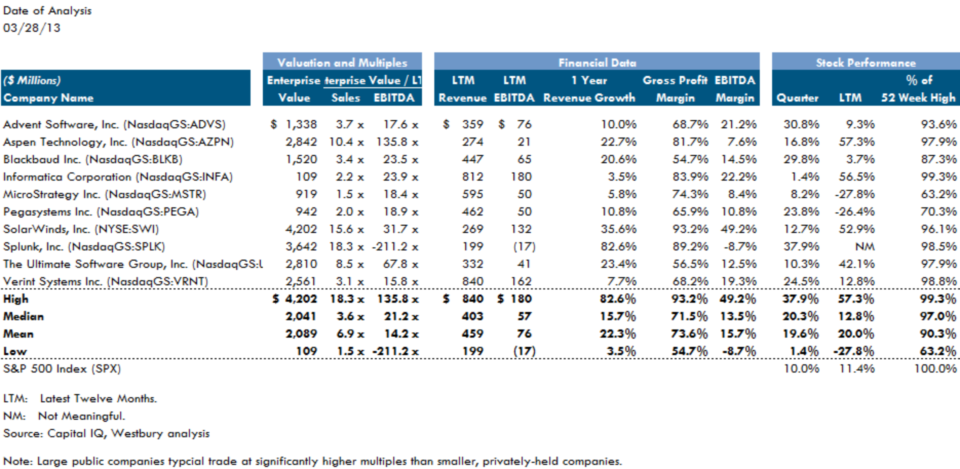
Application Software
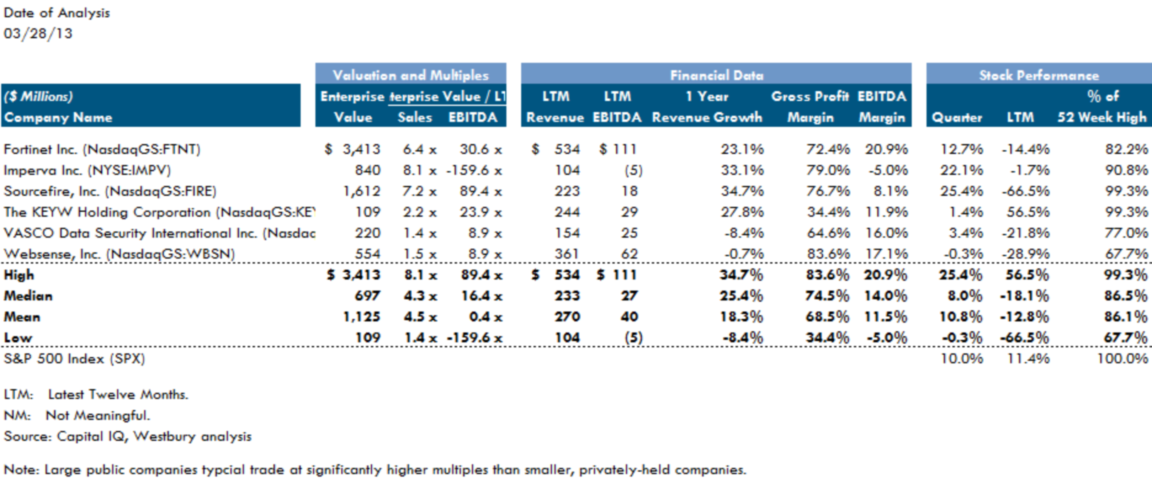
Security Software
As noted above, commercial and government organizations are increasingly concerned about securing both their systems and applications from the rapidly growing number of planned and opportunistic attacks launched by organized crime, state-sponsored actors, and hacktivists. We are closely following the Security Software subsegment as cybersecurity spending by financial investors and operating companies rises.
Software VC Investments & IPOs in the US
US venture capital (VC) investments in general were down in 2012 versus 2011. According to PwC’s MoneyTree Report, they declined 10% in 2012 to $26.5 billion. But US VC software investments continued to grow last year and attracted far more money from VCs than any other industry: $8.3 billion spend on 1,266 deals. This was the highest level of VC software funding since 2001. Versus 2011, it marked a 10% increase in capital deployed and an 8% increase in the number of deals.
As for IPOs in 2012, the Software industry accounted for six of US’ 10 largest tech IPOs in the US. These included:
- Workday (NYSE:WDAY). Provides enterprise cloud applications for human resources and finance;
- Splunk (NASDAQ:SPLK). Enables organizations to monitor, search, analyze, visualize and act on massive streams of real-time and historical machine data; and
- ServiceNow (NYSE:NOW). Provides a cloud-based SaaS platform that automates enterprise IT operations.
Recent Software M&A Deals
M&A transactions didn’t hit new highs in 2012 like VC investments, but they were still ahead of most other sectors. Deal makers closed 1,537 M&A transactions in 2012, up 1% over 2011, while M&A deal values fell by about 20% to $68.5 billion mostly due to a greater proportion of smaller deals. Also because the deals were smaller, Berkery Noyes calculates that the median revenue multiple decreased slightly from 2.2x in 2011 to 2.1x and the median EBITDA multiple declined from 12.9x to 11.9x.
Most 2012 deals (58%) were valued from $2.7 million to $33.1 million. However, the following 10 transactions accounted for one-third of 2012’s total M&A deal value:
- Cisco’s acquisition of NDS Group for $4.96 billion
- SAP’s acquisition of Ariba for $4.4 billion
- Dell’s acquisition of Quest Software for $2.4 billion
- Turaz’ acquisition of Mysis Plc for $2.01 billion
- Oracle’s acquisition of Teleo for $1.9 billion
- RedPrairie’s acquisition of JDA Software for $1.9 billion
- Roper Industries’ acquisition of Sunquest Information Systems for $1.39 billion
- VMware’s acquisition of Nicira for $1.26 billion
- IBM’s acquisition of Kenexa for $1.21 billion
- One Equity Partners’ acquisition of M*Modal for $1.05 billion
The chart below details software M&A transactions in Q1 2013. Of particular interest is TripWire’s announcement in March that it agreed to acquire nCircle. TripWire develops risk and security applications. nCircle is a vendor of IT security and compliance solutions. The combined company has 2012 revenues of $140 million, making it one of the largest IT security companies in the US. Its mission – to align its clients’ security posture with their business objectives -- is a statement about how crucial IT security has become. nCircle’s investors are an interesting mix of financial institutions and strategics: Menlo Ventures, BV Capital, Alta Partners, JK&B Capital, NTT Finance, Scotiabank and Visa International.
![]()
The Social Media Segment
Segment Manager: Ryan Kuhn
Segment Description
Social Media websites facilitate the exchange of user-generated content between members who share common interests. Examples of such shared interests are myriad: they’re found among friends, business associates, hobbyists, singles, parents, fitness buffs, etc. In addition to segmenting by interest, some social media sites optimize their content for delivery on smart phones versus desktops. Examples of smart phone optimization: Twitter – a microblogging site – and Foursquare – where users broadcast and comment upon their location.
Hundreds of Social Media websites operate today, thousands if one counts the efforts of brands to create their own Social Media platforms.
Social Media’s “many-to-many” architecture markedly differentiates it from traditional “one-to-many” media like TV, radio and print. Among the differences are in editorial quality (lower), reach (lower), frequency (higher), usability (lower), immediacy (higher) and permanence (lower). Market researcher Nielsen claims that users of Social Media in the US spent 121 billion minutes on such sites in July, 2012 versus 88 billion minutes in July, 2012, an increase of 37%.
Many Social Media sites rise and fall in popularity rapidly, almost like fads. Examples of rapidly rising sites today are Pinterest and DeviantArt. Older sites losing users are Facebook and MySpace.
Site | Unique Visitors (M) |
|---|---|
750.0 | |
250.0 | |
110.0 | |
85.5 | |
70.5 | |
65.0 | |
25.5 | |
20.5 | |
19.5 | |
17.5 | |
12.5 | |
12.0 | |
7.5 | |
5.4 |
* Source: eBizMBA, 4/1/13
Because of their users’ willingness to reveal massive amounts of information about themselves, Social Media sites have become magnets for advertisers that use such data to target them. eMarketer estimates that social-network advertising revenue grew 48.5% in 2012 to $7.7 billion. While the most visible part of the Social Media industry may be websites, in fact the M&A action is among players that create, target and distribute advertising content to social media websites.
Social Media Public Comparables
Only two public companies define themselves primarily as Social Media sites: Facebook and LinkedIn. Other public companies prominently use Social Media, but as a tool to advance the sale of merchandise or content: Zynga (social games), DeNa (social games and content), Groupon (local retail deals), Google (search and cloud storage); and Yahoo (content).
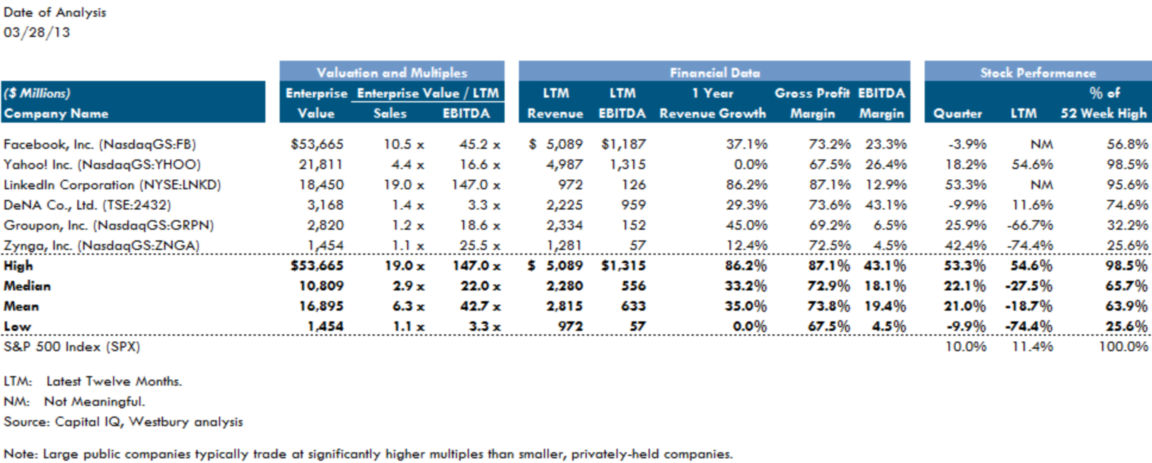
The median annual revenue growth of this group is about 39%, EV/EBITDA is 18.6x, and EV/sales is 4.4x. LinkedIn is remarkable for its valuation: an EV/EBITDA multiple of 147x and an EV/sales multiple of 19x. In other words, assuming no growth, a LinkedIn investor would have to wait 147 years to see his money returned as EBITDA.
Selected Recent Social Media Transactions
As mentioned above, Social Media deals worth more than about $25 million rarely feature the purchase of “pure-play” sites: Large sites are either too pricey for almost any buyer, their user loyalty is fickle, or they’re small and tightly-niched. Rather, deal rosters are dominated by companies that monitor the users of the major Social Media sites (typically those on Facebook and LinkedIn) and feed advertisements to them.
Examples of such deals in 2012 were:
- Gannett’s purchase of Blinq, a company that creates Social Media advertising campaigns for ad agencies and corporate clients. Terms were rumored to be $29 million in cash and another $69 million in contingency payments.
- Oracle’s purchase of Vitrue, a cloud-based Social Media marketing firm that helps major advertisers insert ads in Facebook. The transaction was valued at $300 million.
- Another Oracle purchase, this of Involver. "The combination of Involver with Oracle is expected to create the most advanced and comprehensive cloud-based social solution across marketing, sales and service touch points," said Involver’s CEO.
- Salesforce’s purchase of Buddy Media whose solutions help CMOs manage Social Media campaigns. Buddy counts as clients eight of the top ten advertisers.
- Microsoft’s purchase of Yammer for $1.2 billion, four years after Yammer was founded. Yammer facilitates social interaction among employees. The solution will be integrated into Microsoft’s Office suite as the company strives to move its applications into the cloud.
Compared to 2012, Social Media deal action in Q1 2013 has been subdued.
- In January, PR powerhouse Ketchum bought Capstrat for an undisclosed amount. Capstrat sells marketing and interactive communications services, including Internet strategy, website design, Social Media network development, and advertising content.
- Also in January, SaaS applications developer Quadrant 4 Systems (sales: $27 million) bought Q4 Mobility. The seller develops mobile apps which include analytics, Social Media, in- app advertising, press and media management, etc.
- In February, Oracle – obviously one of the most active acquirers of Social Media marketing firms -- purchased Eloque for $957 million from a consortium of private equity groups headed by Bessemer Partners. Eloqua’s SaaS applications help clients automate marketing processes and relate them to revenue performance. At the time of acquisition, Eloqua was losing money. Nonetheless, in the only Q1 transaction for which multiples have been published, it sold for 9.7x sales.
- In March, advertising agency conglomerate WPP bought john st. for an undisclosed amount. john st. sells Social Media services: strategy, community management, content creation, social application design and development, monitoring, and analytics, along with advertising content.
Social Media Trends
Expect to see rising interest and continuing Social Media innovation regarding:
- Interaction over images (Examples: Pinterest, Instagram).
- Real-time interaction (Example: Twitter used at live events and for customer service).
- Tighter coordination between brands and prominent online influencers (Example: Facebook).
- Purpose-built apps for mobile platforms (Example: Vine, owned by Twitter, where users trade six-second videos).
- Brands bringing the management of their online communities in-house versus outsourcing it to advertising agencies.
- Privacy protection. Foursquare is seeing fewer location check-ins as it dawns on users that such information in the wrong hands could harm them. In a related development, expect to see more push-back from users as Social Media sites attempt to exploit personal data in new or more invasive ways.
The Telecommunications Segment
Segment Manager: Jon Rubin
Segment Description
The Telecom segment transmits data and content through a wide variety of electronic and fiber optic media and protocols, including wireline, wireless and satellite telephony, cable television, Internet protocol (IP) networks.
In the Telecom segment, mobile and IP-based communications continue to supplant wireline, to the point where the latter exists practically as an endangered species in the North American telecommunications landscape. But the ascendant mobile subsegment also faces challenges. The explosion in content and data coupled with the rapid advance in device technologies has caused mobile data traffic to continue its exponential climb. This rapid increase in turn compels wireless providers to continually upgrade the network infrastructure, a highly capital intensive endeavor. Smart phones, tablets and the mobile Internet in general are the drivers for seemingly insatiable demand for bandwidth. The challenge for wireless providers is to find ways to monetize their network infrastructure more effectively, to find new sources of revenue to pay for past and future investment.
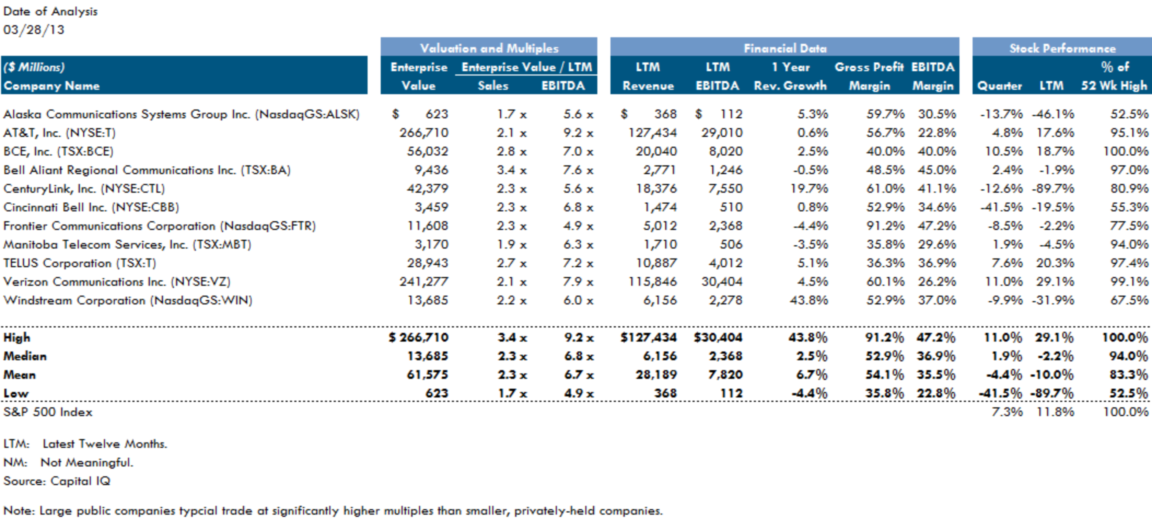
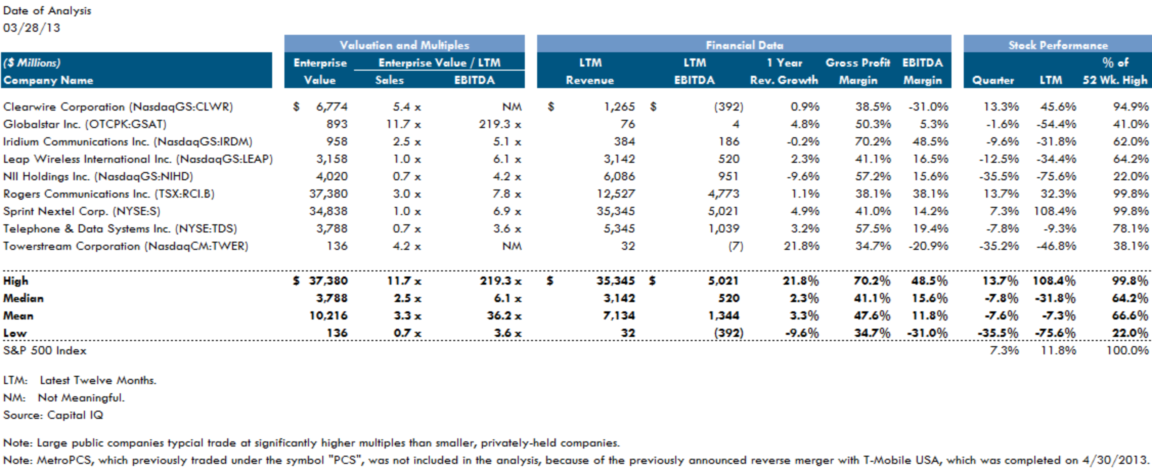
Telecom Public Comparables
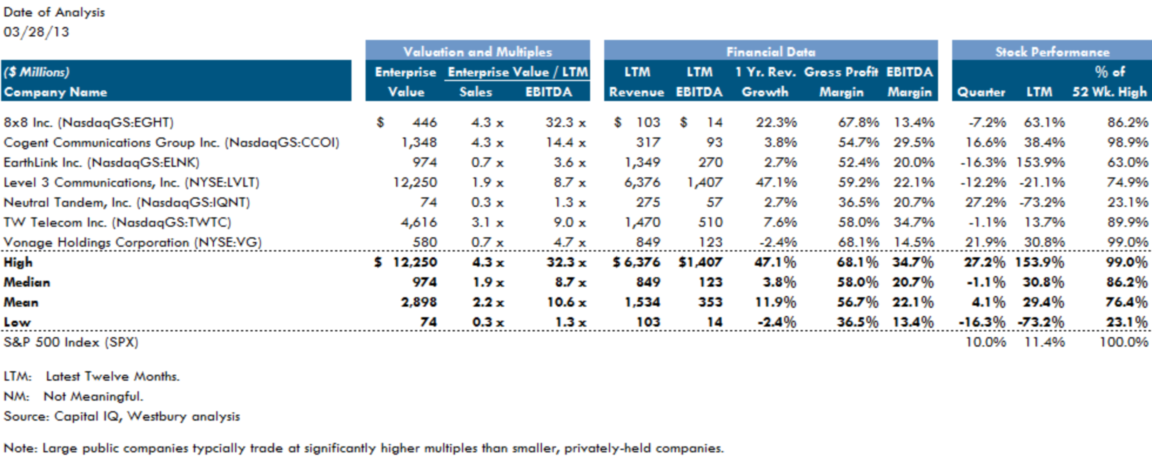
Alternative/IP Carriers
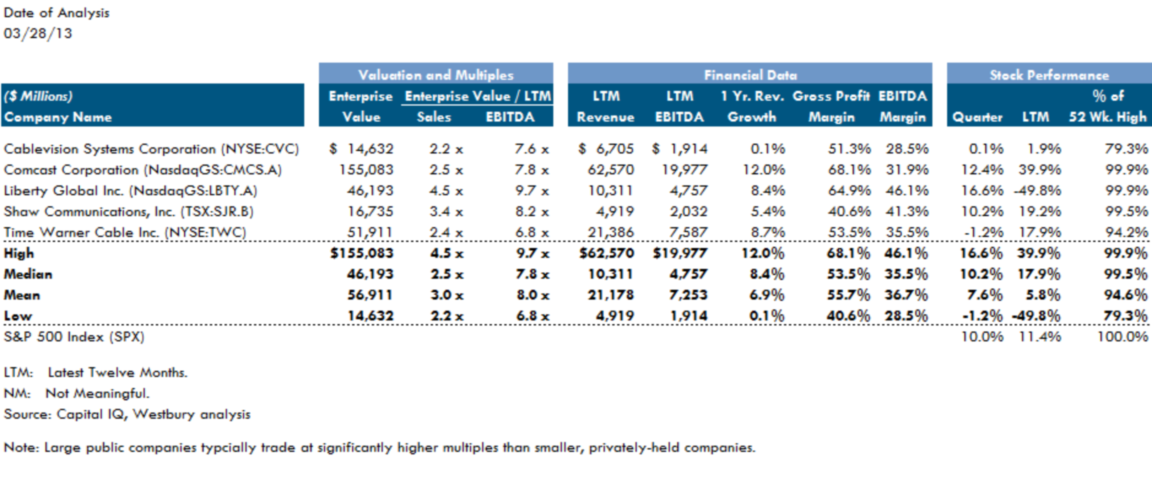
Cable Television
Diversified Telephony
Wireless/Satellite
Selected Recent Telecom Transactions
With no blockbuster deals announced in the segment, we turn to a deal that was announced, but not closed. Telephone and Data Systems’ (NYSE:TDS) purchase of Baja Broadband was announced on February 27. The purchase price is $267.5 million, representing a 3.25X revenue multiple for the sellers, M/C Partners and Columbia Capital. The allure of Baja is its fully built-out (well, 96%) network, upgraded to DOCSIS 3.0, allowing the company to deliver market-leading high speed Internet access. The interesting aspect to the transaction is the buyer: TDS is primarily telephony and data services provider. The Baja acquisition thus represents a foray into a new service market for TDS, a $5 billion Fortune 500 company.
| Implied Enterprise Value/ | ||||||
|---|---|---|---|---|---|---|
| Closed Date | Target | Buyer | Business | EV | Revenues | EBITDA |
| 01/10/2013 | Black Rock Cable | Wave Broadband, LLC | Fiber optic networks in Northwest Washington | $47.0 | ||
| 01/07/2013 | Iowa Wireless Services LLC, 119 Towers | TowerCo LLC | Wireless cell phone towers. | 45.5 | ||
| 01/31/2013 | Fremont Telcom Co. and Fretel Communications, LLC | Blackfoot Telecommunications Group, Inc. | Local exchange and communications services, calling cards, voice mail, and custom calling services | 30.0 | 3.75X | 6.0X |
| 01/02/2013 | Litecast/Balticore, LLC | Zayo Group, LLC | Metropolitan fiber infrastructure provider to the Baltimore business community | 22.0 | ||
| 02/08/2013 | VIVARO Corporation | Next Angel LLC | Telecommunications and financial services and products to the Hispanic community | 5.5 | ||
| 03/04/2013 | Community Networks Inc. | Platinum Communications (TSXV:PCS) | Fixed wireless residential, business, and industrial Internet services in the Calgary area | 2.5 | ||
| 03/18/2013 | mBlox, Inc., Premium SMS Business | OpenMarket Inc. | Enterprise to mobile messaging services. | |||
| 03/06/2013 | CURRENT Group, LLC | Ormazabal Y Cia., S.A. | Broadband communications services for the electric utility and residential customers | |||
| 02/28/2013 | Cellular Specialties, Inc., Customer Solutions Group | Goodman Networks, Inc. | In-building wireless solutions business including distributed antenna systems, Wi-Fi, and public safety solutions | |||
| 02/11/2013 | Titan Communications Inc. | Teliphone Corp. (OTCPK:TLPH) | Phone and communications services | |||
| 01/22/2013 | SignalShare LLC | SignalPoint Communications | Temporary and permanent wireless Internet solutions for the sports and entertainment industries, as well as for corporate events | |||
| 01/09/2013 | ESI Hosted Services, LLC | Estech Systems | Voice over Internet protocol (VoIP) services to businesses | |||
| 01/01/2013 | Unknown Stakes in Computers & Tele-Comm Inc. and KC Nap LLC | Streamside Partners | Wireless broadband services for businesses, hotel access, and residential homes | |||
| 01/02/2013 | Crossbridge Solutions Inc. | Telit Communications (AIM:TCM) | Wireless data network machine-to-machine (M2M) business solutions services | |||
| 03/04/2013 | Wireless Matrix USA Inc. | CalAmp (NasdaqGS:CAMP) | Mobile satellite services | |||
| 02/11/2013 | Cutthroat Communications, Inc. | Blackfoot Telecom | Internet, data transport, and voice services | |||
| 02/28/2013 | Franklin Group Inc. | Towerstream (NasdaqCM:TWER) | Fiber and fixed microwave network in Houston and Dallas | |||
| 01/14/2013 | TORQ Communications, LLC | Digital Utilities Ventures (OTCPK:DUTV) | Data networking, traditional telephony building, and business-grade voice over internet protocol (VOIP) services | |||
| High | $ 47.0 | |||||
| Median | 26.0 | 3.75X | 6.0X | |||
| Mean | 25.4 | |||||
| Low | 2.5 | |||||
The Internet & Digital Media Segment
Segment Manager: Andrew Winick
Segment Description
Internet advertising revenues in the US reached $26 billion through Q3 of 2012, another record, according to the Interactive Advertising Bureau (IAB). Extrapolating through the remainder of 2012 would put total Internet advertising spend at about $36 billion. That compares to revenues of $31 billion in 2011 and $26 billion in 2010, for a 2010 – 2012 CARG of 18%.
This breathtaking growth is being propelled by the increasing ability of marketers to target consumers with precision (that is, to increase the probabilities that consumers will buy what they’re selling), and by their use of more effective tools to quantify results. The result is that each year, Internet advertising accounts for a larger and larger share of total advertising.
The key forces playing out in the Internet and Digital Media segment are:
- Globalization;
- Mobile device usage;
- User interface innovation;
- New media advertising spend;
- Content creation;
- Hardware-software symbiosis.
While the performance of the US and global economy will affect all segment players, the fates of individual companies lie in the hands of these six forces.
As for globalization, customers of the largest segment competitors -- Apple, Google, Facebook, etc. -- are predominantly outside the US. In fact, from 2007 - 2010, China added 246 million more users than the US. The larger American companies are becoming truly trans-national.
The growth of 3G mobile device subscriptions is increasing rapidly, with the US, Japan, Korea and China growing fastest. In particular, the number of smart phones and tablets users keeps popping, a trend analysts believe will continue for the foreseeable future. The more phones, the more Internet and Digital Media revenues.
User interface innovations include technologies like touch screens (for smart phones, tablets and desktops) and sound (e.g., Siri and Bluetooth). Device and desktop makers are devoting ceaseless efforts to making interfaces more intuitive, faster and convenient, with some striving to create air-gesture modalities. These innovations spark additional demand.
Digital media advertising spend, which has grown from $55 million worldwide in 1995 to $73 billion in 2011, is powered by paid search and display advertising directed into the massive Social Media communities (see preceding chapter).
The creation of original content remains important, a fact recognized by the prominence it receives from Google, Bing, Mozilla, etc. In fact, the major search engines have resisted efforts by content aggregators to create distribution hubs by ignoring them, or cutting through them to access original content. Industry workers are busy inventing more efficient ways to generate and curate quality content as an antidote to low-quality Social Media postings.
Last, expect more symbiotic interaction between hardware and software vendors. As an example, note how the iPhone, with its elegant design and functionality, has pushed the revenues of applications developers to unprecedented levels. No longer is the smart phone a utilitarian object: as its applications grow, it becomes an extension and facilitator of the user’s desires.
With 85% of the world’s population now able to access commercial wireless signals (a higher reach than the electrical grid’s 80%), we expect the Internet and Digital Media segment to continuing providing superior wealth creation opportunities.
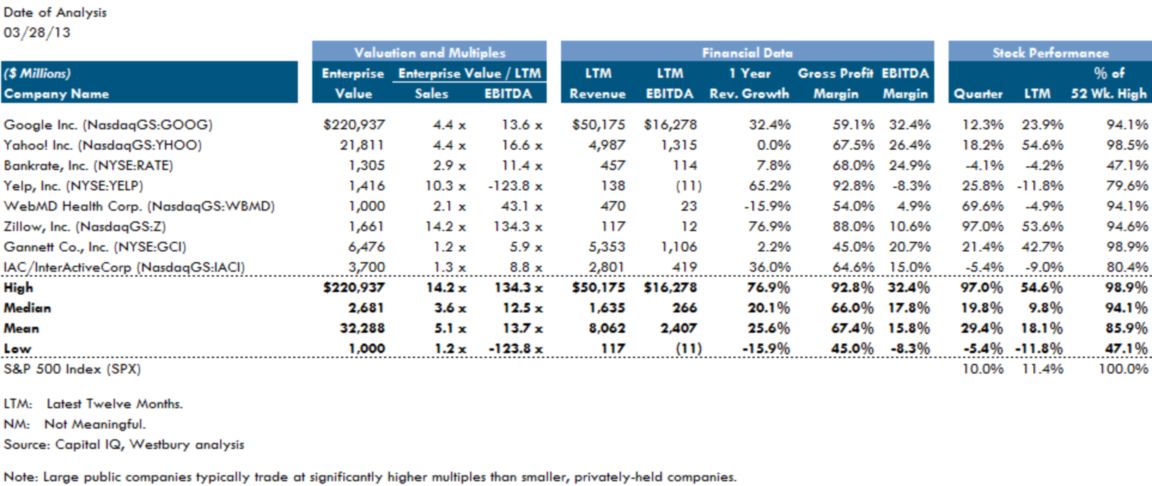
Internet & Digital Media Public Comparables
Companies that generate the bulk of their revenue from digital content demonstrate far faster and more profitable growth than their print counterparts. Compare Zillow to Gannett. Market share or sheer scale also matter as Google makes clear.
Selected Internet & Digital Media M&A Transactions
M&A activity in the sector declined in 2012 versus 2011 by 35% worldwide, or $134 billion. In general, buyers were hesitant to engage in large, transformative technology deals due to the uncertain macroeconomic environment, valuation volatility and a perception that certain Internet & Digital Media companies are riding fads.
However, the number of deals closed in 2012 remained mostly unchanged as buyers took smaller risks with smaller, highly-focused targets that control proprietary intellectual property. The average value of deals closed in 2012 was $188 million, down 14% from $218 million in 2011. Larger transactions include IAC’s purchase of About.com for $300 million in Q3 of 2012, a deal valued at 5.5x EBITDA; and private equity firms Permira and Spectrum’s purchase of Ancestry.com for $1.6 billion, (10x EBITDA). Both these targets control robust and diverse content, as well as a larger, stable user base, making them attractive to advertisers.

The IT Services Segment
Segment Manager: Tim Williamson
Segment Description
Broadly defined, IT Services companies deliver technical consulting services and related products to customers that desire to outsource those functions and assets.
According to IDC, the most important forces affecting the segment in 2013 (and all of TMT, for that matter) will be mobile devices, cloud services, social technologies, and Big Data. The coming year will probably witness major moves related to these technologies as the market shifts from the "exploration" stage to full-blown, high-stakes competition and consolidation. The players’ ability or inability to compete will reset leadership ranks in the IT market and in many industries that use IT. In more detail, those key forces are:
- Spending Growth: Worldwide IT spending in 2013 will exceed $2.1 trillion, up 5.7% from 2012, driven both by the new technologies mentioned above and by emerging markets.
- Smart mobile devices and tablets (SMD) will grow by 20%, generate 20% of all IT sales, and drive 57% of all IT market growth. Without SMDs, IT industry growth would be just 2.9%.
- Emerging market IT spending will grow by 8.8% to over $730 billion, twice the growth of the developed markets, representing 34% of all IT spending and 51% of all IT growth.
- Surging Tablet Demand Driven by Minis: In 2013, mini tablets (devices with sub-8 inch screens) will account for as much as 60% of unit shipments, a remarkable leap from just 33% in 2012.
- Critical Year for Mobile Software: Mobile platforms that fail to attract at least half of the most productive applications developers risk gradual extinction. Microsoft now sits at 33%; RIM at 9%.
- The SaaS M&A Shopping Spree Begins: Analysts estimate that over $25 billion in SaaS acquisitions will occur over the next 20 months, up from $17 billion in the past 20 months.
- The Rise of “Industry Platform as a Service” (PaaS): The number of industry-focused cloud services platforms, less than 100 in 2012, will increase tenfold by 2016, while "horizontal" PaaS will become progressively commoditized.
- “Line-of-Business” (LOB) Executives Rule: By 2016, 80% of new IT investments will directly involve LOB executives, with LOBs the lead decision makers in half or more of those investments. As businesses become ever more reliant on IT, business decision-makers will exert more control over what IT applications and services they use.
- Datacenter Disruption: Converged systems and software-defined networks will drive growth and open the door for market share upheaval among datacenter providers. "Bring your own ID" (BYOID) will permit consumers to enjoy the protections of enterprise security, something desperately needed as passwords fall to powerful code-cracking technologies.
- Big Bad Data: As this cluster of technologies matures, it’s moving from search functions to discovery to prediction, the Holy Grail. As a result, Big Data M&A will focus on companies that develop visual discovery, predictive analytics tools, and that perform text and rich media analysis.
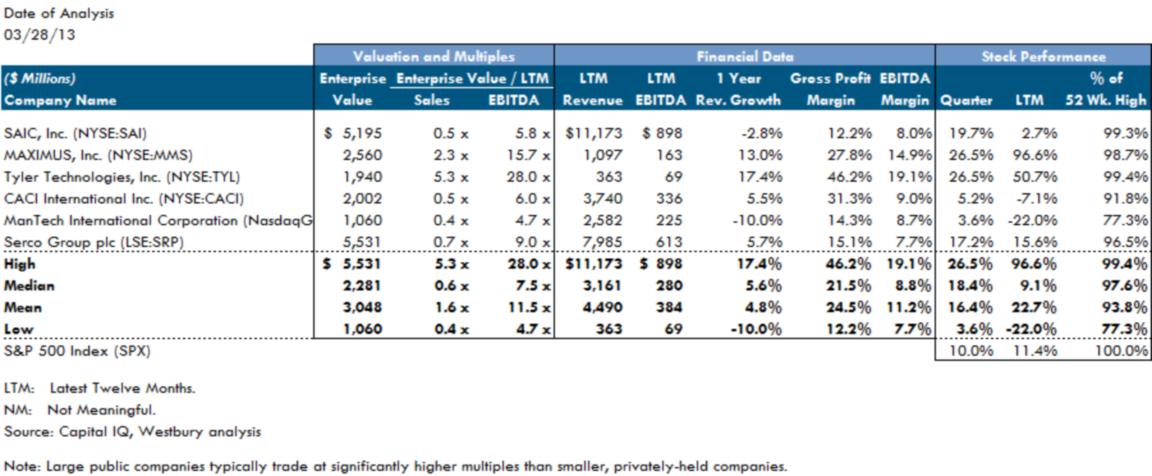
IT Services Public Comparables
We divide relevant pubic companies into six subsegments:
- Government IT Consulting
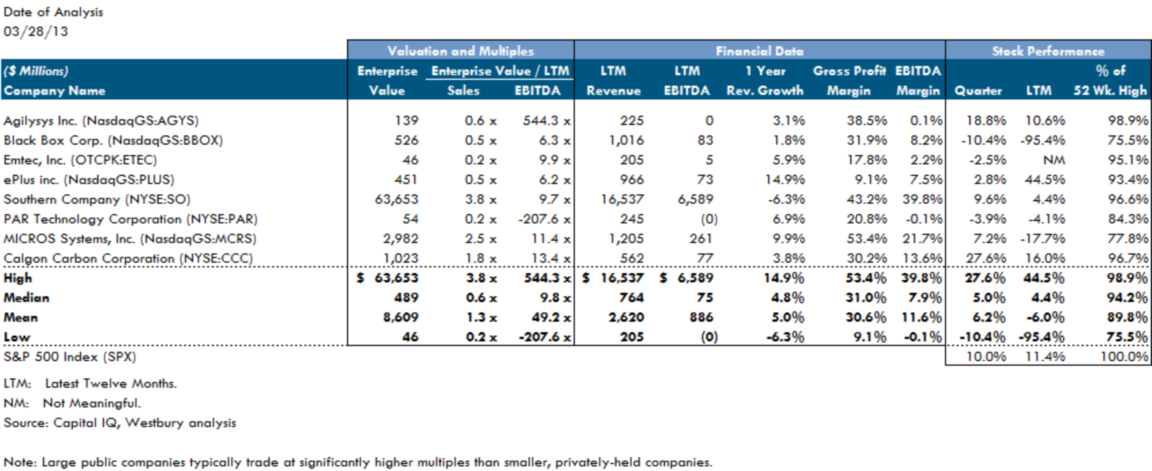
- IT Solutions Providers
- Business Process Outsourcing
- IT Value Added Resellers
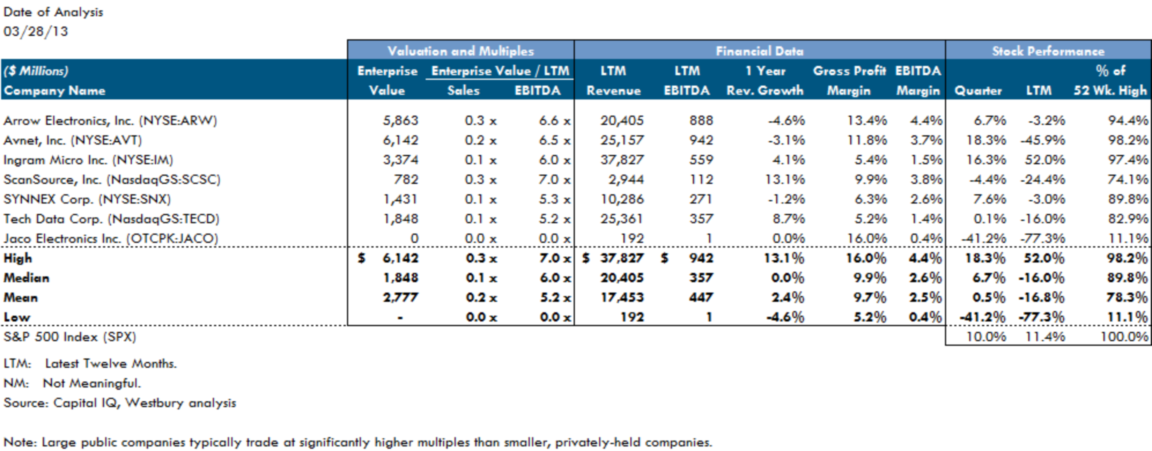
- IT Distribution
- IT Direct Marketers & Retailers
Government IT Consulting
IT Solutions Providers
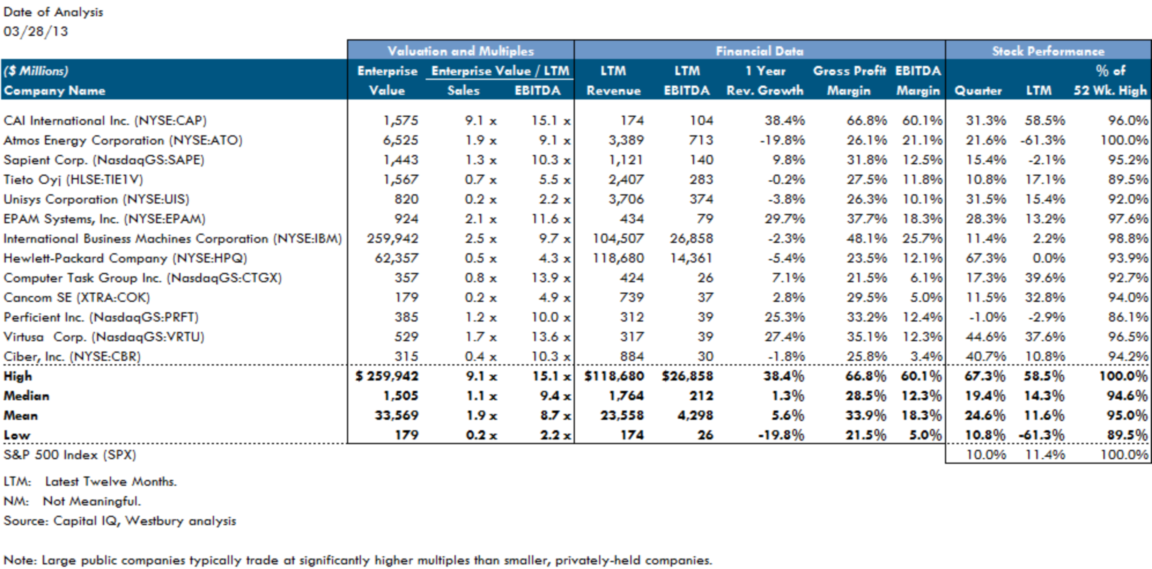
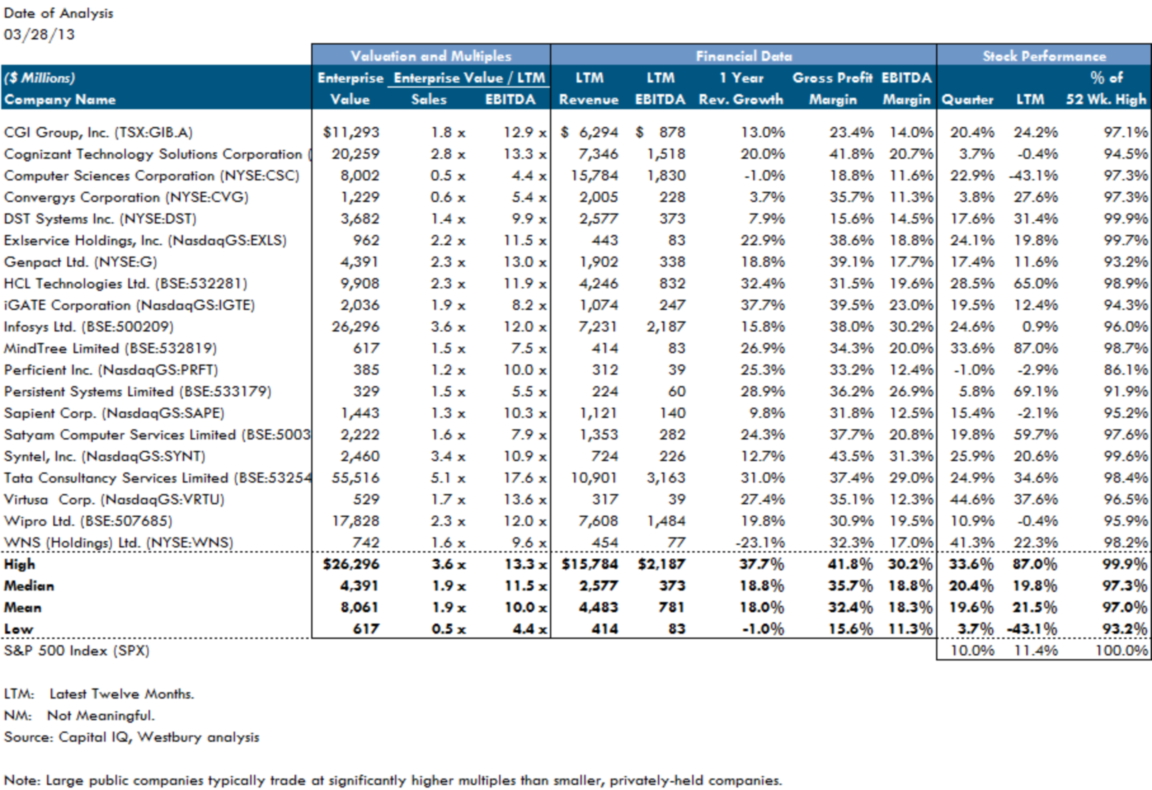
Business Process Outsourcing
IT Value Added Resellers
IT Distribution
IT Direct Marketers & Retailers
Selected IT Services M&A Transactions
We divide M&A transactions into four subsegments:
- IT Consulting
- BPO & Data Processing Services
- Technology Distributors
- Computer Electronics & Internet Retailing
The lines are blurring and overlapping between IT Services delivery models. Example: IBM, traditionally considered a Big Iron manufacturer, has become one of the leading IT VARs as well as a major consultancy. Across the IT Services industry, the drive is on to find higher-margin products and services like consulting, outsourcing and software. Therefore, the segmentation of the public comparables above is based on primary activity, while the transaction comparables below are sorted based on primary industry classification
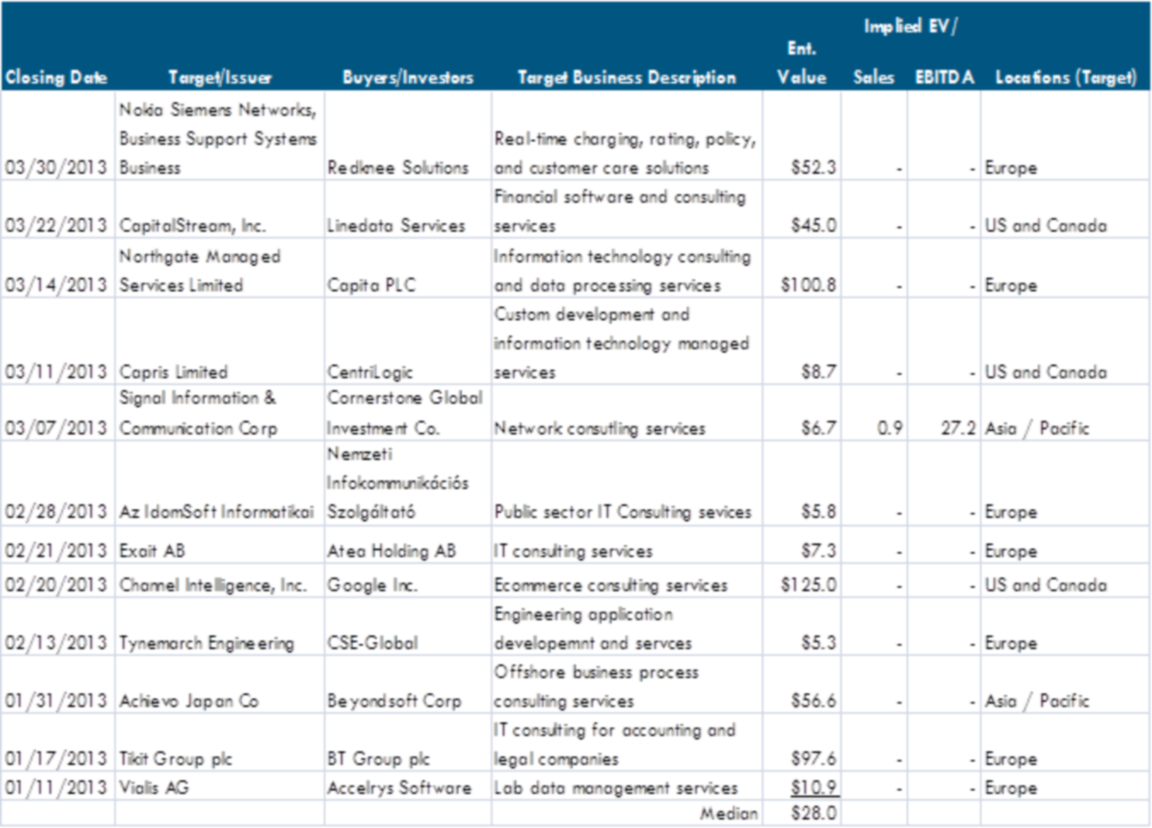
IT Consulting M&A
The traditional IT consultants are Accenture, Cap Gemini and Sapient, with what were formerly hardware manufacturers like IBM and HP now rapidly muscling into the space. No transformative acquisitions occurred among consultancies in Q1 2013, but the three largest deals in the subsegment were:
- Google’s acquisition of Channel Intelligence, a provider of e-commerce services, for $125 million;
- Capita PLC’s acquisition of Northgate Managed Services, a provider of traditional IT consulting services, for $100 million;
- BT Groups’ acquisition of Tikit Group, a provider of financial services consulting, for $98 million.
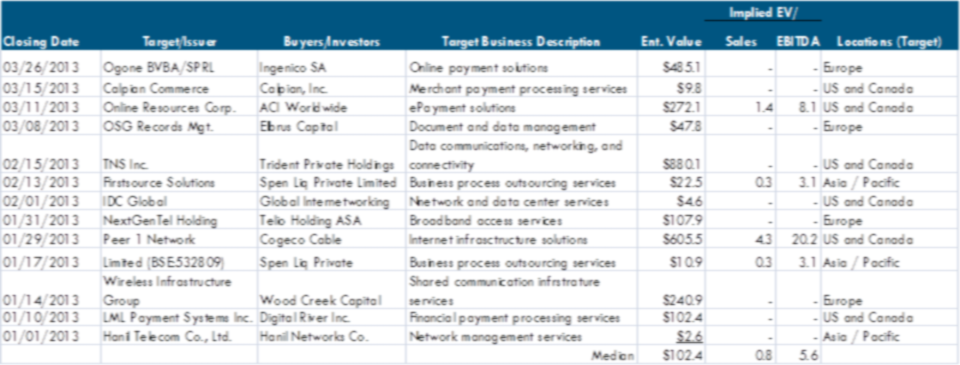
BPO & Data Processing Services M&A
One of the most dramatic trends occurring across all industries for at least a decade has been the outsourcing of technical services to India, although some domestic BPOs like Convergys and Computer Sciences Corp. have also participated in the boom. The Indian players have exploited that country’s price/productivity advantages. Examples: Tata, Infosys and Cognizant with a combined market capitalization of over $100 billion. However, rising salaries for Indian workers are squeezing many Indian outsourcers, and as IT assets become cheaper, some US customers are reversing the trend, moving their outsourcing relationship closer to home to access knowledgeable business process experts. This subsegment accounted for the largest dollar volume in the IT Services Segment.
In Q1 2013, the three largest BPO and Data Processing Services transactions were:
- Trident Private Holdings’ acquisition of TNS, a provider of data communication services, for $880 million;
- Cogeco Cable’s acquisition of Peer 1 Network Enterprises, a provider of Internet infrastructure solutions for $605 million;
- ACI Worldwide’s acquisition of Online Resources, a provider of e-payment solutions, for $272 million.
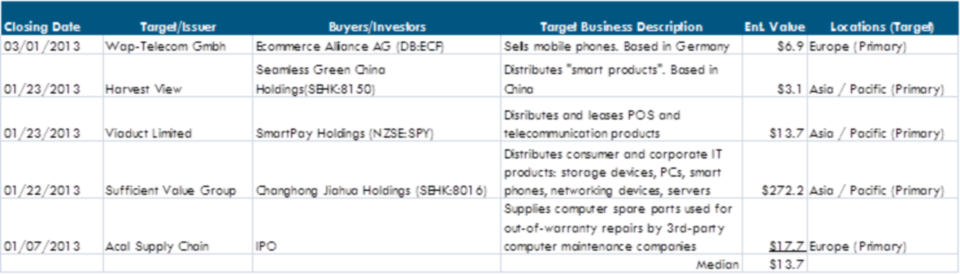
Technology Distributors M&A
This subsegment includes high-volume, low-margin players like Ingram Micro, Arrow, Avenet and Tech Data. Arrow and Avnet focus heavily on hardware sales while others sell both hardware and software. No classic distributor offers material levels of IT consulting or outsourcing support.
In Q1 2013, one significant deal closed:
- Changhong Jiahua acquired Sufficient Value Group – a broad line technology distributor -- for $272 million.
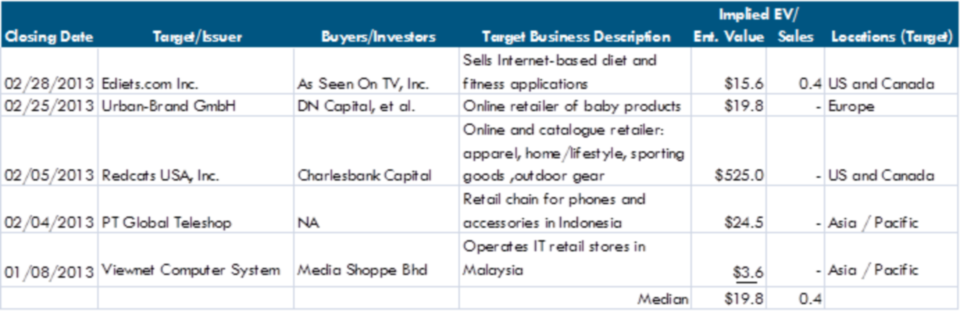
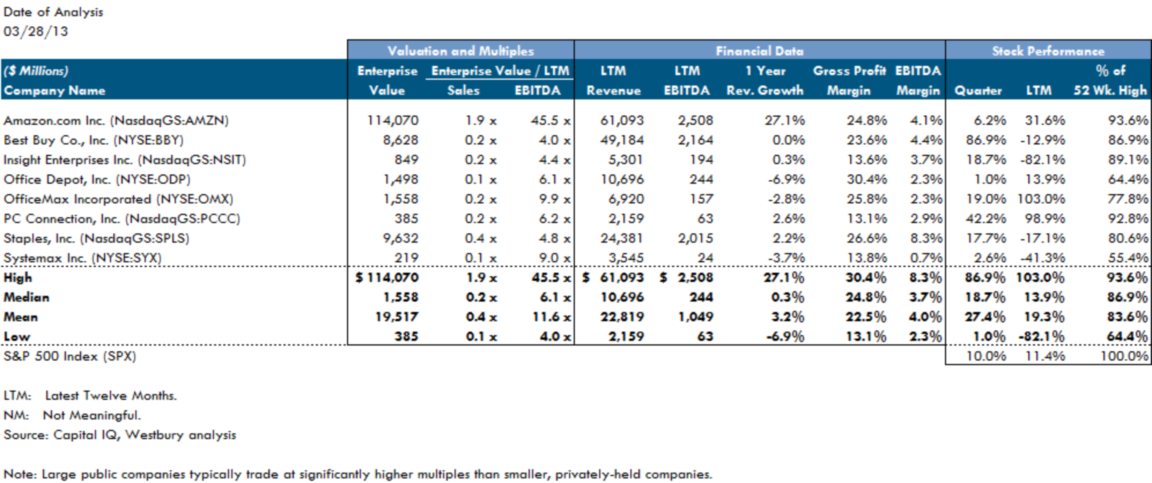
Computer Electronics & Internet Retailing M&A
In this subsegment are catalog companies like Insight and PC Connection: their operations are characterized by lower margins and limited service. Also included here are physical/internet-based retailers like Best Buy, OfficeMax and Staples as well as Amazon.
In Q1 2013, one significant deal closed:
- Charlesbank Capital and Webster Capital acquired Redcats USA for $525 million, which is and online and catalog retailer of plus sized apparel, home products and sporting goods.